Remember pouring over page after page of perfectly normal well data, line by line, just looking for the occasional telltale anomaly that might indicate a problem requiring attention? Or copying and pasting lines of production data into a spreadsheet to track trends?
Oh, you remember that too well because—it was just this morning? So, you don’t have a way to distill all that data into a graph or chart so you can instantly spot spikes, valleys and trends?
Then I am pleased to introduce you to dashboards in DeltaV SaaS SCADA. I think the two of you will get along famously.
Here’s just one example of how Dashboards can make you much more efficient helping you boost production as well as your own productivity, quickly solve pump issues, pipeline leaks, tank issues and more. SaaS Dashboards can take daily gas meter reports and quickly show you a chart or graph of the flow, with datapoints at whatever interval you’ve chosen.
Instantly Recognize Production Data Trends
You can instantly see any spikes or trends. If everything’s okay, great, you move on to the next well or field. If there’s an issue, you’ve probably already received an alarm. But if the change is too small for the alarm you’ve set, yet it’s still of note, you can drill down for more details or send someone to the site.
Want to evaluate different time periods or fields? Set the parameters to any timeframe you need, short or long—yesterday, last week, last month, last year—as far back as your database reaches. Watch static pressure, tank levels, flow rates and compare any set of parameters you need in order to get a more complete picture of the site.
Another part of the beauty of this is that the same data can be charted for engineers, operators, production, accounting and any other department. You’re all using the same data in a single database.
This unity of data makes everyone more efficient, and it creates a sense of transparency, so issues can be worked on by every pertinent department.
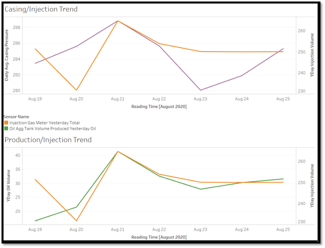
Use Dashboards to Visualize Your Company Data
The chart below shows how you can visualize various production trends.
We have a significant list of standard reports you can start using right away. If you need special reports, that’s great, they can be added either of two ways. If your staff can create them, we’ll consult with you to make that work. Or, you can tell us what you want to see, and we’ll create the report for you.
We’ll be glad to share other ways Dashboards can help you instantly understand what you need to know!